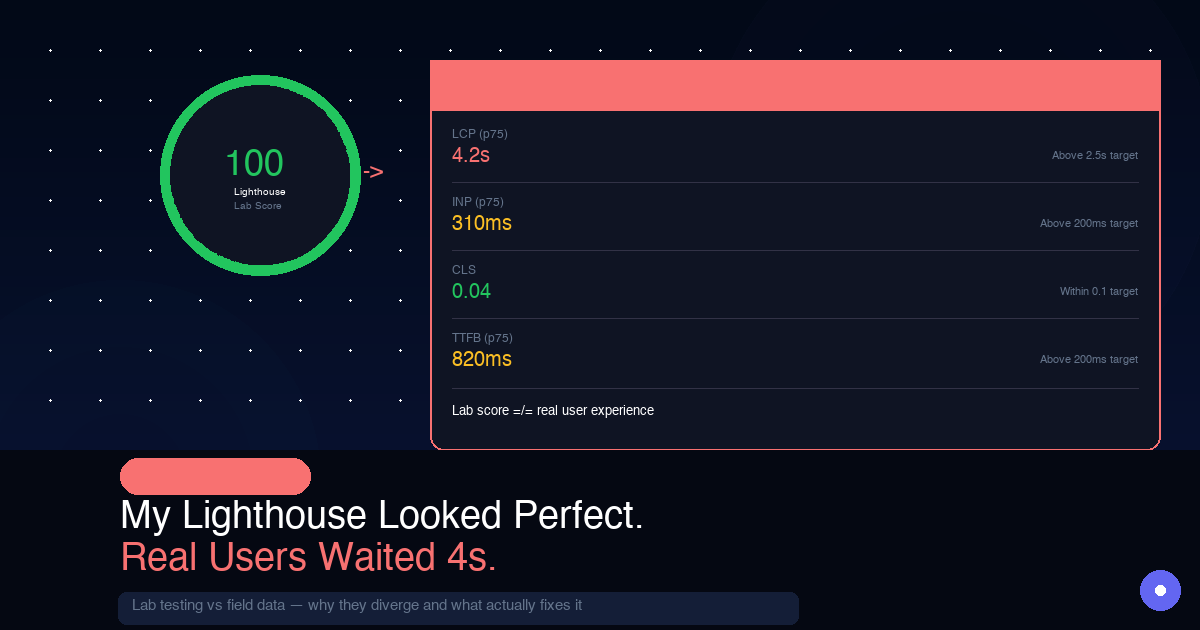
A strong Lighthouse score can make you feel safe too early.
That was the trap I fell into while building OnlyFrontendJobs. In lab conditions, the page looked healthy. In field data, mobile users were waiting far longer than the score suggested. The mismatch was not theoretical. It showed up in p75 LCP, interaction quality, and the amount of main-thread work happening before the page actually felt usable.
This post is a debugging write-up from that gap. I’ll walk through the three issues that mattered, why the tooling did not highlight them clearly enough, and what actually moved the numbers for real users.
This analysis is based on production debugging work on OnlyFrontendJobs, using field data from Vercel analytics and validation in Chrome DevTools under constrained conditions.
The Gap That Shocked Me
Lab data from my M3 MacBook Pro over fast Wi-Fi in Chrome DevTools:
LCP:  0.8s  ✅
FCP:  0.6s  ✅
TBT:  120ms ✅
CLS:  0.01  ✅
Real user data from Vercel Speed Insights at p75 mobile:
LCP:  3.9s  ❌  (good = < 2.5s)
FCP:  2.1s  ⚠️  (good = < 1.8s)
INP:  280ms ⚠️  (good = < 200ms)
CLS:  0.04  ✅
That is not a rounding error. It is a 4x gap on LCP.
Before getting into the bugs, it helps to understand why this gap exists. If you miss the root cause, you end up optimizing for the wrong scoreboard.
Why Lighthouse and Real Users Tell Different Stories
Lighthouse is a lab tool. It simulates a single device in controlled conditions:
- device: motorola moto G4 equivalent (per google's documentation, lighthouse simulates a 2016-era midrange android phone — not your laptop)
- network: throttled 4G (40 Mbps down, 10ms RTT in optimal conditions)
- location: local test run from your machine — no DNS lookup time, no CDN cold starts, no server processing latency
- user state: fresh page load, empty cache, no prior navigation
Your real users are:
- on actual midrange android phones with 2GB RAM and a thermal-throttled CPU
- on real mobile networks in India where 3G/4G can drop to 1–2 Mbps in crowded areas
- hitting your server from across the country — not localhost
- landing on a page that has to cold-start a CDN edge, do a real DNS lookup, and establish a TLS handshake
The W3C notes that LCP in the field includes "unload time from the previous page, connection set-up time, redirect time, and other TTFB delays" — none of which exist in a local Lighthouse test.
This is why Google explicitly says to measure LCP at the 75th percentile of real page loads — not your DevTools average. The p75 user is on a mid-range phone in Jaipur on a 4G connection that just walked out of a metro station. That is your real performance bar.
With that context in place, here are the three bugs.
Bug 1: The Framer Motion LCP Trap
This one cost me roughly 1.2 seconds of LCP on mobile.
What I Had
My job listing cards animated in on page load, with a staggered fade-up effect and 0.1 second delays between cards:
// JobCard.tsx — original version
import { motion } from "framer-motion";

export function JobCard({ job, index }: { job: Job; index: number }) {
  return (
    <motion.div
      initial={{ opacity: 0, y: 20 }}
      animate={{ opacity: 1, y: 0 }}
      transition={{ duration: 0.4, delay: index * 0.1 }}
    >
      <h2>{job.title}</h2>
      <p>{job.company}</p>
      {/* ... */}
    </motion.div>
  );
}
It looks harmless. It is a 0.4 second fade. The problem is where it lands in the rendering pipeline.
The Actual Problem
The problem is that LCP does not care about your animation intent. It measures when the largest element actually appears painted on screen. If your hero content starts at opacity: 0 and fades in over 400ms, the browser records that delay.
Lighthouse still gave me a good score. Why?
Two reasons:
- Lighthouse simulates your test device — on an M3 MacBook, Framer Motion's JavaScript parses and executes in about 20ms. On a midrange Android phone with a throttled CPU, that same JavaScript can take 200-400ms to execute before the animation even starts.
- Lighthouse stops timing LCP when visible content "stabilizes" — a fade animation from
opacity: 0can distort that heuristic in some runs.
The real kicker was bundle cost. Framer Motion is not huge, but on a slow connection even a modest client-side dependency can become expensive. In my case, just downloading the library before the animation could start added meaningful delay for p75 mobile users.
I verified this in the Performance tab, not Lighthouse, by recording a real page load with network throttling set to Slow 4G. The call stack looked like this:
[network] framer-motion chunk downloaded: +380ms
[js parse] framer-motion parse + execution: +180ms
[paint] first job card opacity reaches 1: +560ms total delay
        → this is when browser records LCP
That was 560ms of pure animation-related overhead on top of everything else happening during startup.
The Fix
There are three reasonable fixes, depending on how much you care about keeping the motion:
Option A: remove entrance animations from above-the-fold content
// JobCard.tsx — fixed version
// No motion wrapper for above-the-fold cards
// Animation only for cards that scroll into view

export function JobCard({ job, index, isAboveFold }: JobCardProps) {
  // First 4 cards (visible on load) = no animation
  if (isAboveFold) {
    return (
      <div className="job-card">
        <h2>{job.title}</h2>
        <p>{job.company}</p>
      </div>
    );
  }

  // Cards below fold = animate on scroll (doesn't affect LCP)
  return (
    <motion.div
      initial={{ opacity: 0, y: 20 }}
      whileInView={{ opacity: 1, y: 0 }}
      viewport={{ once: true, margin: "-50px" }}
      transition={{ duration: 0.3 }}
    >
      <h2>{job.title}</h2>
      <p>{job.company}</p>
    </motion.div>
  );
}
Option B: use CSS animations instead
/* globals.css */
@keyframes fadeUp {
  from { opacity: 0; transform: translateY(16px); }
  to   { opacity: 1; transform: translateY(0); }
}

.job-card {
  animation: fadeUp 0.4s ease forwards;
}

/* Stagger via CSS custom property */
.job-card:nth-child(1) { animation-delay: 0ms; }
.job-card:nth-child(2) { animation-delay: 80ms; }
.job-card:nth-child(3) { animation-delay: 160ms; }
.job-card:nth-child(4) { animation-delay: 240ms; }
CSS animations can be a better fit when the effect is simple. They avoid extra JavaScript parsing, reduce main-thread pressure, and are easier to keep out of the critical rendering path.
Option C: keep Framer Motion, but lazy load it
// Only load framer motion after the page has loaded and is interactive
import dynamic from "next/dynamic";

const MotionDiv = dynamic(
  () => import("framer-motion").then(mod => mod.motion.div),
  { ssr: false } // Don't ship to server, load lazily on client
);

// Use regular div for SSR/initial load, MotionDiv after hydration
Result after the fix: LCP on mobile dropped from 3.9s to 2.6s. It still needed more work, but this one change alone recovered about 1.3 seconds.
Bug 2: Hydration Competition Stealing the Main Thread
This one barely showed up in Lighthouse. It was mostly a field problem.
What Was Happening
Next.js App Router works like this on the client:
- The server sends HTML, which the browser can paint quickly.
- React downloads, parses, and runs on the client.
- React hydrates the HTML, attaches event listeners, syncs state, and makes the page interactive.
The problem is that hydration is expensive CPU work. On a midrange Android phone, hydrating a complex page can easily eat hundreds of milliseconds of main-thread time.
During that window, the browser is busy running JavaScript, reconciling the tree, and trying to keep up with paint work. If your page is already heavy, the LCP element can lose the race.
I was making that worse in three different ways.
Mistake 1: unnecessary client components at the top of the tree
// ❌ before — marked entire layout as client component
// app/layout.tsx
"use client"; // ← this was here because of one useEffect

export default function RootLayout({ children }) {
  useEffect(() => {
    // Track page view — the only reason this was "use client"
    analytics.track("page_view");
  }, []);

  return (
    <html>
      <body>
        <Navbar />
        {children}  {/* Everything inside hydrates eagerly */}
        <Footer />
      </body>
    </html>
  );
}
Because the layout was a client component, React had to hydrate the entire page tree before it could mark anything as interactive. On mobile, this took about 600ms.
// ✅ after — server component layout, extract client logic
// app/layout.tsx (server component — no "use client")
export default function RootLayout({ children }) {
  return (
    <html>
      <body>
        <Navbar />
        {children}
        <Footer />
        <AnalyticsTracker /> {/* Small isolated client component */}
      </body>
    </html>
  );
}

// components/AnalyticsTracker.tsx
"use client";
export function AnalyticsTracker() {
  useEffect(() => {
    analytics.track("page_view");
  }, []);
  return null; // Renders nothing — just runs the effect
}
Now hydration only runs for the components that actually need it. The job listing cards, which are server components, do not hydrate at all.
Mistake 2: hydration mismatch causing a full re-render
A hydration mismatch happens when the HTML sent by the server does not match what React tries to render on the client. When that happens, React throws away the server HTML and renders again from scratch on the client, which effectively doubles the work.
I had this in two places:
// ❌ Different on server vs client: causes hydration mismatch
function JobListHeader() {
  return (
    <p>Showing jobs as of {new Date().toLocaleTimeString()}</p>
    // Server renders: "Showing jobs as of 10:30:22 AM"
    // Client renders: "Showing jobs as of 10:30:24 AM" (2 seconds later)
    // React: mismatch → full re-render
  );
}

// ✅ If the difference is intentional, suppress the warning
function JobListHeader() {
  return (
    <p suppressHydrationWarning>
      Showing jobs as of {new Date().toLocaleTimeString()}
    </p>
  );
}

// ✅ Better: do not render dynamic time on the server at all
function JobListHeader() {
  const [time, setTime] = useState<string | null>(null);

  useEffect(() => {
    setTime(new Date().toLocaleTimeString());
  }, []);

  return (
    <p>
      {time ? `Showing jobs as of ${time}` : "Latest frontend jobs"}
    </p>
  );
}
The QuintoAndar engineering team documented a very similar issue. In their case, hydration mismatches caused an LCP regression that stayed hidden for weeks.
Mistake 3: loading too much JavaScript before hydration could complete
// ❌ Before: imported a heavy newsletter widget at the top level
// That forced the browser to download and parse it before hydration
import NewsletterWidget from "@/components/NewsletterWidget";

export default function HomePage() {
  return (
    <>
      <JobList />
      <NewsletterWidget />  {/* 45kb widget, loaded synchronously */}
    </>
  );
}

// ✅ After: lazy-load everything not critical for initial paint
const NewsletterWidget = dynamic(
  () => import("@/components/NewsletterWidget"),
  {
    ssr: false,
    loading: () => <div className="h-48 bg-gray-100 rounded-xl animate-pulse" />,
  }
);
Combined result of all hydration fixes: main-thread blocking time dropped from 680ms to 190ms. INP improved from 280ms to 140ms. LCP dropped by another 0.6 seconds.
Bug 3: The Third-Party Widget Blocking the Main Thread
After fixing the first two bugs, mobile LCP was down to 2.1s. Better than 3.9s, but still not where I wanted it.
I used Chrome DevTools with Slow 4G + 6x CPU slowdown to simulate a budget Android device and found a long task on the main thread. A third-party live chat widget was executing a 480ms JavaScript task right when the browser was trying to paint the LCP element.
The timeline looked like this:
t=0ms    Browser starts parsing HTML
t=180ms  First Contentful Paint (static HTML visible)
t=320ms  [chat widget script starts downloading]
t=680ms  [chat widget JS executes — 480ms long task]
          ↑ MAIN THREAD BLOCKED HERE
t=1160ms [LCP element finally painted]
          ↑ Lighthouse measures LCP here
The chat widget was executing synchronous JavaScript that blocked the main thread for nearly half a second, exactly when the browser was trying to do its most important rendering work.
Why Lighthouse Missed This
Lighthouse often ran without fully capturing the widget cost. The script came from a third-party CDN, and depending on timing, it either loaded after the LCP measurement window, benefited from cache, or failed quietly under throttling.
In real sessions, the widget loaded fresh much more often, and on a slow connection it blocked the main thread at exactly the wrong moment.
The Fix
I used three layers of defense:
1. Delay third-party scripts until after the page is interactive
// components/ThirdPartyScripts.tsx
"use client";

export function ThirdPartyScripts() {
  useEffect(() => {
    // Load only after the page is interactive and 2 seconds have passed
    // That gives LCP room to finish before these scripts run
    const timer = setTimeout(() => {
      loadChatWidget();
      loadAnalytics();
    }, 2000);

    return () => clearTimeout(timer);
  }, []);

  return null;
}

// Or use next/script with strategy="lazyOnload"
import Script from "next/script";

// In layout.tsx:
<Script
  src="https://widget.intercom.io/widget/xxx"
  strategy="lazyOnload"  // Loads after page is fully interactive
/>
2. Use scheduler.yield() to break up long tasks
If a third-party script absolutely has to run early, you cannot always control it. What you can do is make your own code yield to the browser between expensive chunks of work:
// Before processing large data sets or doing multiple DOM updates:
async function processJobData(jobs: Job[]) {
  const results = [];
  for (let i = 0; i < jobs.length; i++) {
    results.push(transformJob(jobs[i]));

    // Yield to the browser every 50 items
    // Lets it paint frames, handle input, and keep rendering responsive
    if (i % 50 === 0 && "scheduler" in window) {
      await (window as any).scheduler.yield();
    }
  }
  return results;
}
3. Audit what you're loading with next/bundle-analyzer
# Add to next.config.js:
const withBundleAnalyzer = require("@next/bundle-analyzer")({
  enabled: process.env.ANALYZE === "true",
});

# Run:
ANALYZE=true npm run build
Then look at what is in the main bundle versus what can be lazy-loaded. Common offenders are date libraries like Moment.js, icon libraries imported wholesale, and analytics SDKs that load synchronously.
Result after the fix: LCP dropped from 2.1s to 1.4s. Final p75 mobile LCP: 1.4 seconds.
The Final Numbers
| metric | before | after | change |
|---|---|---|---|
| p75 LCP mobile | 3.9s | 1.4s | -64% |
| p75 FCP mobile | 2.1s | 1.1s | -48% |
| INP | 280ms | 140ms | -50% |
| main thread blocking | 680ms | 95ms | -86% |
| lighthouse score | 94 | 97 | +3 (irrelevant) |
Notice how little the Lighthouse score moved. Lab metrics can improve while the lived experience barely changes, and the reverse is also true.
The Debugging Toolkit I Use Now
I still use Lighthouse, but not as my source of truth for production performance. This is the stack I actually rely on:
Vercel Speed Insights — real-user Core Web Vitals data, with p75 breakdowns by device type.
Chrome DevTools Performance tab — always record with Slow 4G + 6x CPU slowdown enabled. That gets much closer to what a midrange Android phone feels like than a clean desktop run.
web-vitals npm package — instrument your own real-user measurements:
// app/layout.tsx
import { onLCP, onINP, onCLS, onFCP } from "web-vitals";

export function PerformanceObserver() {
  useEffect(() => {
    onLCP(metric => {
      console.log("LCP:", metric.value, "rating:", metric.rating);
      // Send to your analytics:
      analytics.track("cwv", {
        name: metric.name,
        value: metric.value,
        rating: metric.rating,
        navigationType: metric.navigationType,
      });
    });

    onINP(metric => analytics.track("cwv", { name: "INP", ...metric }));
    onCLS(metric => analytics.track("cwv", { name: "CLS", ...metric }));
  }, []);

  return null;
}
Chrome User Experience Report (CrUX) — Google's real-user data for any URL, available through PageSpeed Insights or BigQuery.
The Checklist
Before shipping any important Next.js page, I run through this:
LCP
[ ] Hero image uses <Image priority> or has fetchpriority="high"
[ ] No entrance animations on above-the-fold content (or use CSS only)
[ ] LCP element is not lazy-loaded (loading="lazy" kills LCP)
[ ] Server renders the LCP element — it's in the initial HTML, not client-rendered

HYDRATION
[ ] Layout.tsx is a Server Component (no "use client" at root)
[ ] No Date.now() / Math.random() / window references in server components
[ ] No unnecessary "use client" on components that don't use hooks
[ ] Check console for hydration warnings in development

MAIN THREAD
[ ] Third-party scripts use strategy="lazyOnload" or load after 2 seconds
[ ] Heavy libraries (moment, lodash, large icon sets) are lazy-loaded or replaced
[ ] Bundle analyzer run — no surprises in main bundle
[ ] Long tasks < 50ms in devtools (record with Slow 4G + 6x CPU)

MEASUREMENT
[ ] Vercel Speed Insights or similar RUM tool installed
[ ] Measuring p75, not average
[ ] Checking mobile data, not desktop
One More Thing
The engineers who understand the gap between lab and field data are the ones who ship products that actually feel fast. Not to developers on M3 MacBooks with fiber, but to users on budget Android phones over inconsistent mobile networks.
That is the audience that decides whether your product feels good or frustrating.
If you care about real-world frontend performance, browse frontend jobs on OnlyFrontendJobs and look for teams that value Core Web Vitals, rendering strategy, and production debugging.